Voting in Benzie County: Voter Registration & Turnout
Voter turnout was a record high for the 2016 presidential primary.
For the last few years, I’ve been crunching data about voter turnout and voting results for Benzie County, and I’ve also compared these data with population demographics. It’s just kind of a hobby — something fun to do, trying to figure out statistically why Benzie County works the way that it does. #ilovespreadsheets
I’ve heard from a few people that they’d like to know more and see this info, so I decided to write a blog post explaining some of the cool trends that I’ve found. As I started assembling everything, it made sense to break up my initial one blog post into a few blog posts based on topic, and this is the first in the series… enjoy!
———————————————————————————————————————————————————-
1. BENZIE COUNTY HAS HIGH VOTER REGISTRATION: And by high, I mean *literally* off the charts.
OK, let me explain. If you are 18 or older, you are considered part of the Voting Age Population (also known as VAP), meaning that you are old enough to vote. But let’s face it, not everyone who is old enough to vote actually registers to vote. Moreover, not everyone who is old enough to vote is even eligible to register to vote: thus there is an entirely separate category called Voting Eligible Population (VEP), which excludes non-citizens, criminals, and others who are 18 years of age or older (so they fit into VAP) but are not eligible to vote (so they don’t fit into VEP).
All of the confusing lingo aside, let’s look at how many people who are old enough to vote (VAP) are actually registering to vote.
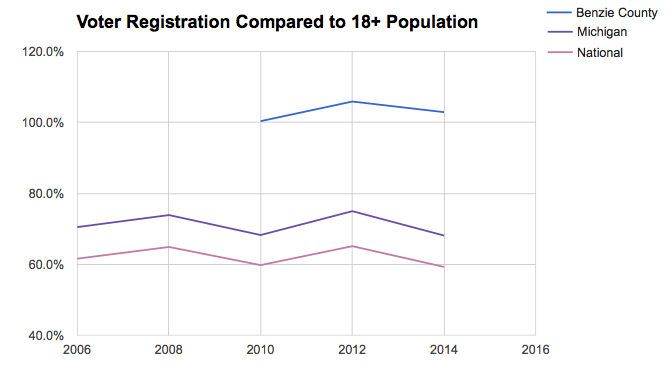
Over the last decade, only six out of 10 Americans who were old enough to vote (VAP) actually were registered to vote — this ranged from a high of 65 percent in 2012 to a low of 59 percent in 2014. In Michigan, that statistic is a little higher: it’s more like seven out of 10 Michiganders over the last decade. (A high of 75 percent in 2012 and a low of 68 percent in 2014.)
So what’s voter registration like in Benzie County? Ummm, it’s literally off the charts: 102 percent in 2010, 100 percent in 2012, 103 percent in 2014.
Wait, what? How is that possible? Well, the most likely scenario is that someone’s numbers are off: either the number of registered voters in Benzie County or the Census estimate for how many adults are living here.
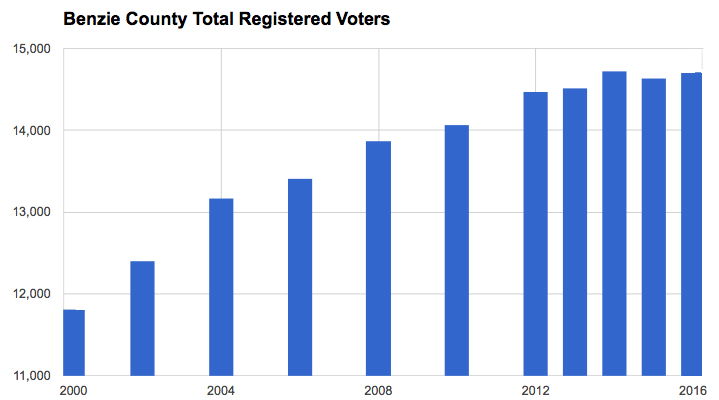
That’s because, in order to get a figure of more than 100 percent, this means that we have more people registered to vote in Benzie County than the number of adults that the U.S. Census has estimated are living in Benzie County. (Maybe it has to do with a high proportion of “snowbirds” voting absentee here in Benzie County but not getting counted here by the Census?) For instance, the U.S. Census estimated that we had 17,519 people living in Benzie County on July 1, 2014, and an estimated 14,155 (80.8 percent) were 18 years or older. But according to state records, we had 14,562 registered voters here in July 2014.
Regardless of why the data is off and by how much it is off, I doubt very much that it would make *that* big of a difference: I bet that our numbers would still hover closer to 100 percent than to the national average of 60 percent or the state average of 70 percent. And I think that this is pretty amazing. To even be close to 100 percent voter registration — let alone to be over 100 percent — means that something is going on here in Benzie County to make us register to vote more than other places, but what is it? I’m not entirely sure, but I have a sneaky suspicion that our active Benzie County League of Women Voters, Republicans, and Democrats play a big role. On top of that, I know from experience that students at Benzie Central High School get extra credit in their government and civics classes, which all students are required to take, when they register to vote.
If you have other ideas as to why our registration numbers are so high compared to our general adult population, I’d love to hear your thoughts, so please comment below!
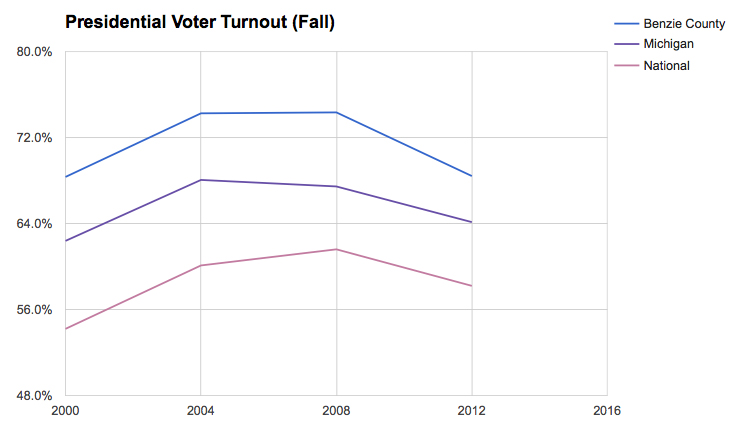
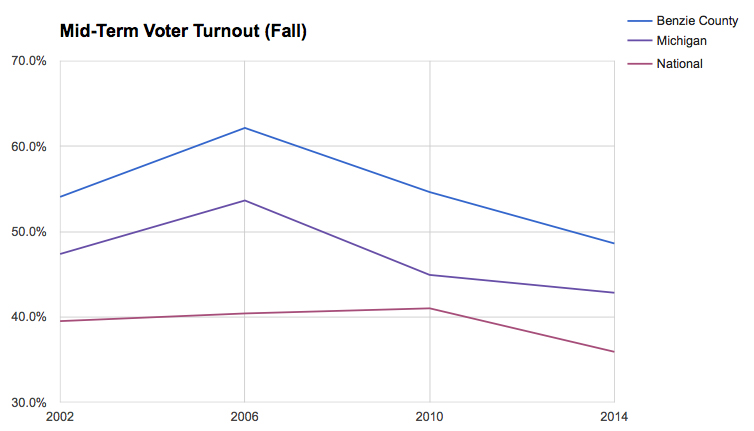
2. BENZIE COUNTY HAS HIGH VOTER TURNOUT: And by high, I mean 7 percent higher than turnout in Michigan and 15 percent higher than national turnout, as a general rule.
When it comes to voter turnout, many media outlets have reported that Benzie is often among the top counties in the state to have people show up to the polls. “Registered Voter Turnout” is voter turnout as a percent of the registered voter list who actually voted on election day — note that this does not count people who are not registered to vote. In Michigan, you have to be registered three weeks before the date of an election to be able to vote.
Across the country, there is generally lower turnout in primary elections, in off-year elections for state legislators (called “mid-term” elections), and in local elections. However, regardless if it’s a presidential election in the fall or a presidential primary in the spring, regardless if it’s a presidential year at all or if it’s just a mid-term Senate race, Benzie County tends to turn out in numbers that far exceed the national and state averages.
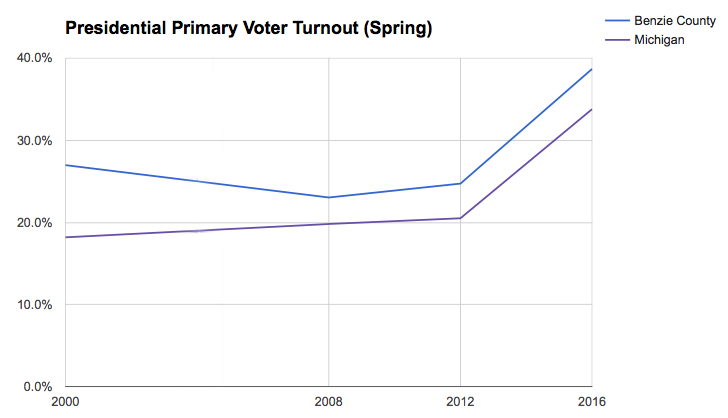
And yesterday’s presidential primary was no exception: voter turnout in Benzie County was 38.7 percent yesterday, compared with 33.8 percent on the state level. And while it’s true that voter turnout has been higher than normal throughout the United States during this presidential primary, yesterday wasn’t an isolated incident — consistently over the past decade and a half, Benzie County has had turnout numbers that average 5 percentage points higher than Michigan as a whole: as much as 8.8 percent higher in 2000 and as low as 3.2 percent higher in 2008.
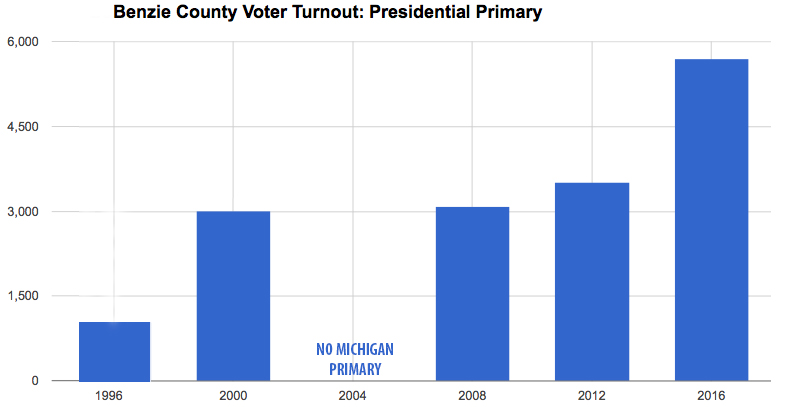
In fact, we had incredible turnout yesterday for the presidential primary in Benzie County — around 2,200 more people voted yesterday than in the 2012 primary!
And no, you can’t blame that (solely) on an increase registered voters, because the number of registered voters in Benzie County has increased by only 500 since 2012. Nor can you blame it on this year having both a Republican presidential primary and a Democratic presidential primary, whereas 2012 only had a Republican presidential primary, because yesterday’s numbers were also well above 2008, the last time that we had both a Republican and a Democratic primary: we had 5,696 voters turn out yesterday compared with 3,516 in 2012 and 3,090 in 2008.
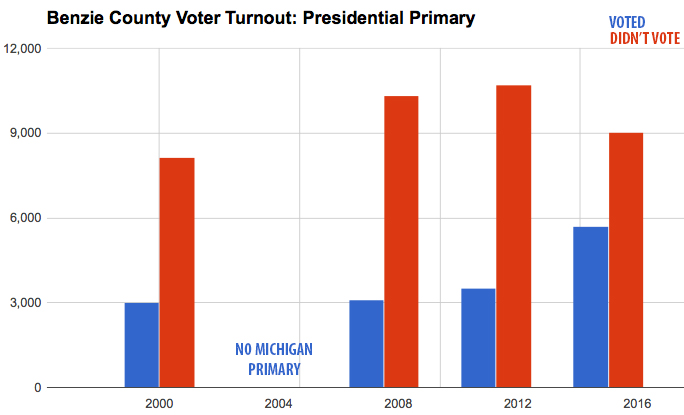
In other words, yesterday’s primary helped to close the gap in the number of registered voters who vote (in blue) compared with the number who don’t vote (in red) in the graphic below.
To conclude, yay for us in Benze County for rocking the vote, not only in yesterday’s election but in all of the elections!
———————————————————————————————————————————————————-
Stay tuned, as I hope to write another blog post with the results of this presidential primary race, as well as how our election results relate to demographic data for Benzie County on a township level.
Thank you so much for doing this research, which many of us here in the Great County of Benzie find very interesting, but don’t have the skills to compile and communicate so succinctly. I’m not sure why we haven’t seen the level of progressive change in local government that we’d like, but these numbers are encouraging. Thanks again!
I want to thank you for your research and sharing this information.
I also want to give a possibility of our higher voter registration. We have a Secretary of State office in Honor. The women there ask each and every person that walks in to get a drivers license or state ID if they want to register to vote. Their perseverance of getting people to register easily is a big help in our registered voters in Benzie County
Thank you so much for sharing this information and doing so much work to present it in such a clear way! Really an essential part of understanding benco and local politics. If I were a statistician, I’d want to compare Benzie with the rest of the state in terms of voting predictors, i.e. educational level, income level, etc. Seeing your report on increasing turnout makes me happy and supports my faith in Democracy!